LIVE
⭐9.2M influencer listings 🏢101.2K sponsor listings 🌍125.3B combined audience reach 📊13 platforms indexed 🗺️130+ countries covered 🏷️10,000+ niches 🦋4.3M Bluesky creators 🎙️1.4M podcast creators 🟣1.3M Twitch creators 📈761.9K Pinterest creators 🥊331.7K Kick creators 293.1K YouTube creators 𝕏261.6K X creators 🐘259.7K Mastodon creators 🎵142K TikTok creators ✈️109.3K Telegram creators 🎮14.3K Discord creators 📈13.4K Substack creators 🎬4.6K Rumble creators 🧵3.8K Threads creators ⭐9.2M influencer listings 🏢101.2K sponsor listings 🌍125.3B combined audience reach 📊13 platforms indexed 🗺️130+ countries covered 🏷️10,000+ niches 🦋4.3M Bluesky creators 🎙️1.4M podcast creators 🟣1.3M Twitch creators 📈761.9K Pinterest creators 🥊331.7K Kick creators 293.1K YouTube creators 𝕏261.6K X creators 🐘259.7K Mastodon creators 🎵142K TikTok creators ✈️109.3K Telegram creators 🎮14.3K Discord creators 📈13.4K Substack creators 🎬4.6K Rumble creators 🧵3.8K Threads creators
🧭 Explore 🔎 More Knowledge creators 🌍 Top creators in United States YouTube rankings
The Infographics Show
🤝

Make a deal with The Infographics Show

🔒 Paid proposals held safely in escrow — released only when the work's approved.

Every booking is a normal escrow-protected deal.

Subscribers
15.5M
Total Views
7B
Videos
6.4K
Channel age
15 yrs

Known for

▶️ Featured Video

4.8M views
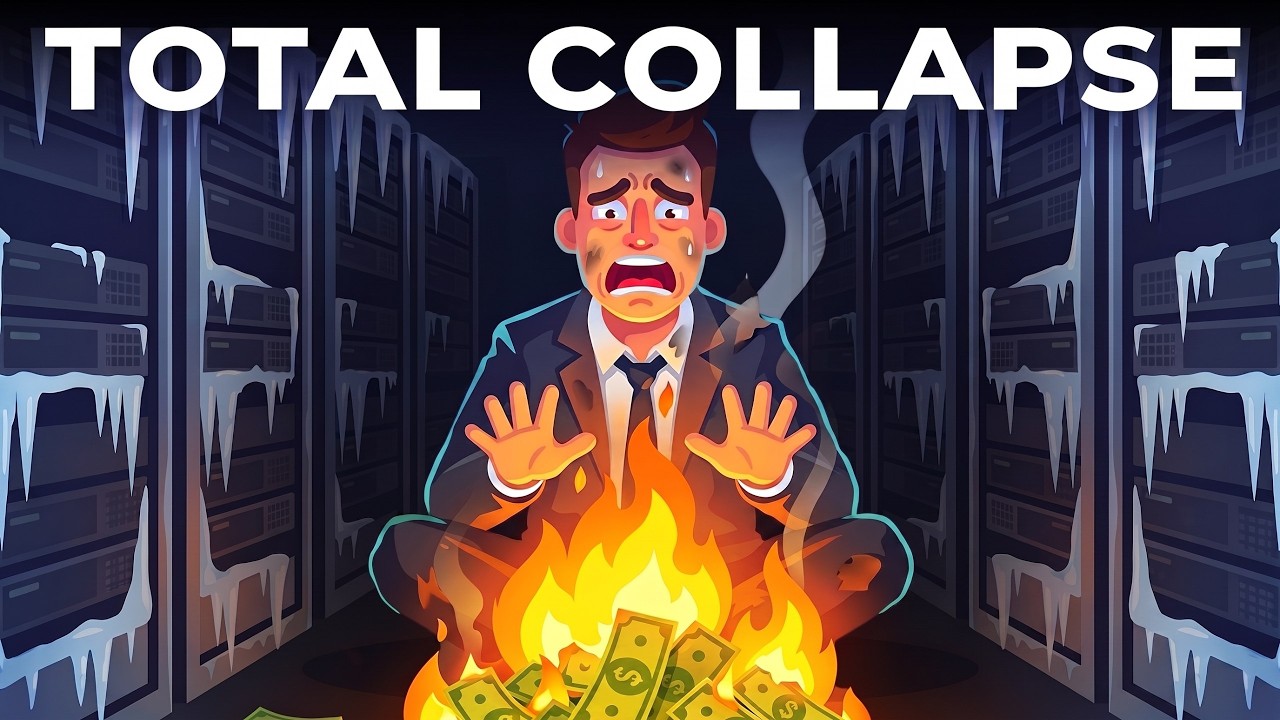
What if the AI Bubble Bursts (Day by Day)

📈 Growth momentum

Holding steady
Subscribers · last 30 days
+0 +0%
A steady, established audience.
Last 7 days
+0
The most recent week — the freshest read on where subscriber growth is heading.

🎯 Reach quality

Subscriber activation · Solid
4.1%
Share of subscribers who watch a typical recent video (avg views ÷ subscribers) — the real reach behind the subscriber count, and a quick check on whether those subscribers are still active rather than a vanity number.
Recent vs all-time
-42%
Recent videos average 635K vs an all-time 1.1M/video — recent uploads run below the all-time norm — much of the lifetime views sit in an older catalogue.
Reach consistency · Variable
35/100
How steady views are across recent videos (typically 250.6K–705.7K) — reach is hit-driven, so results swing from video to video.

📈 Performance

Typical video
250.6K–705.7K views
Median 432.2K — the reliable floor a brand can expect, not just the headline average.
Upload rhythm
11.2× / week
Most active on Saturdays — consistent output keeps an engaged, sponsor-ready audience.
635K
Avg views / video
4.7K
Avg likes
847
Avg comments
11.2
Uploads / week
1.1M
Lifetime avg / video
452
Views / subscriber
0%
Shorts (recent views)
41m 7s
Typical video length

🗓️ Posting schedule

M
T
W
T
F
S
S
Most uploads land on Saturdays · about 11.2 / week — time a launch or drop to ride the channel's own rhythm.

▶️ Top videos

✓ Official stats
Recent uploads · views
Oct 2026latest
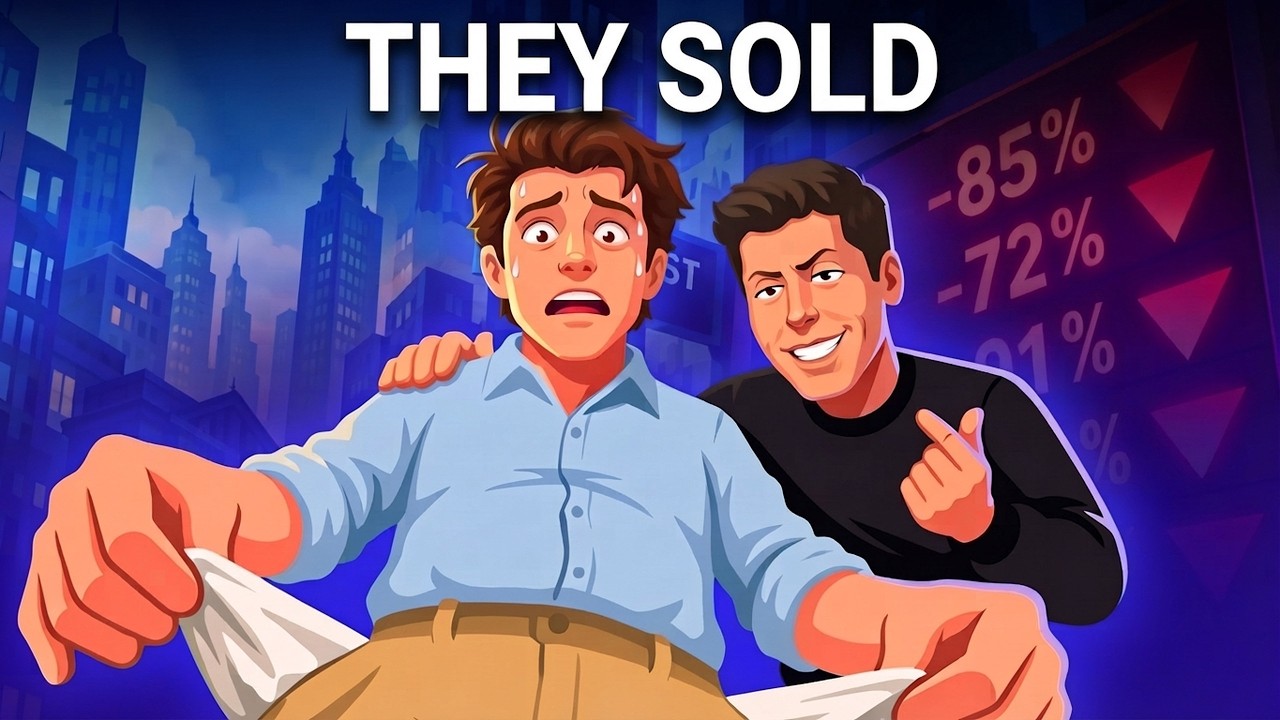
  1. 1 What if the AI Bubble Bursts (Day by Day) 4.8M views · 28.6K likes · 4.2K comments · Sep 2026
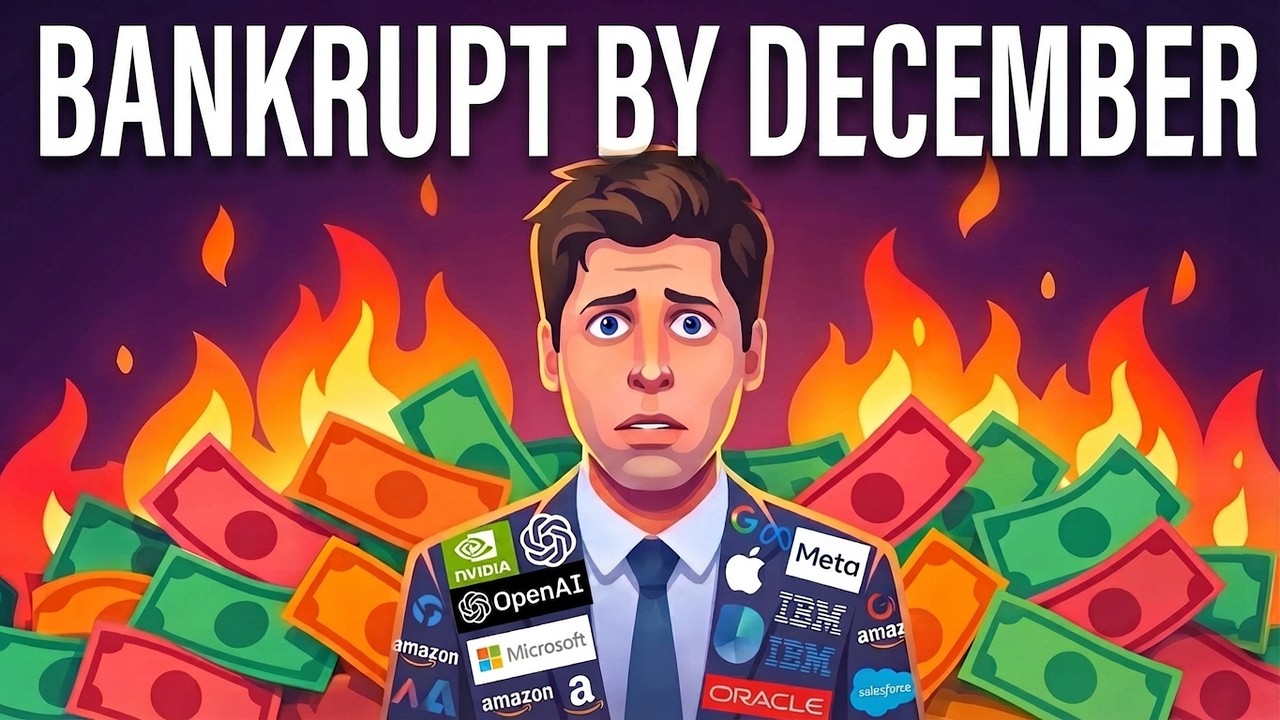
  2. 2 The AI bubble is about to pop... 3.8M views · 32.5K likes · 4.4K comments · Oct 2026
  3. 3 The Leaked Audit That Exposes OpenAI's Real Financial Crisis 2.4M views · 16.1K likes · 2.6K comments · Sep 2026
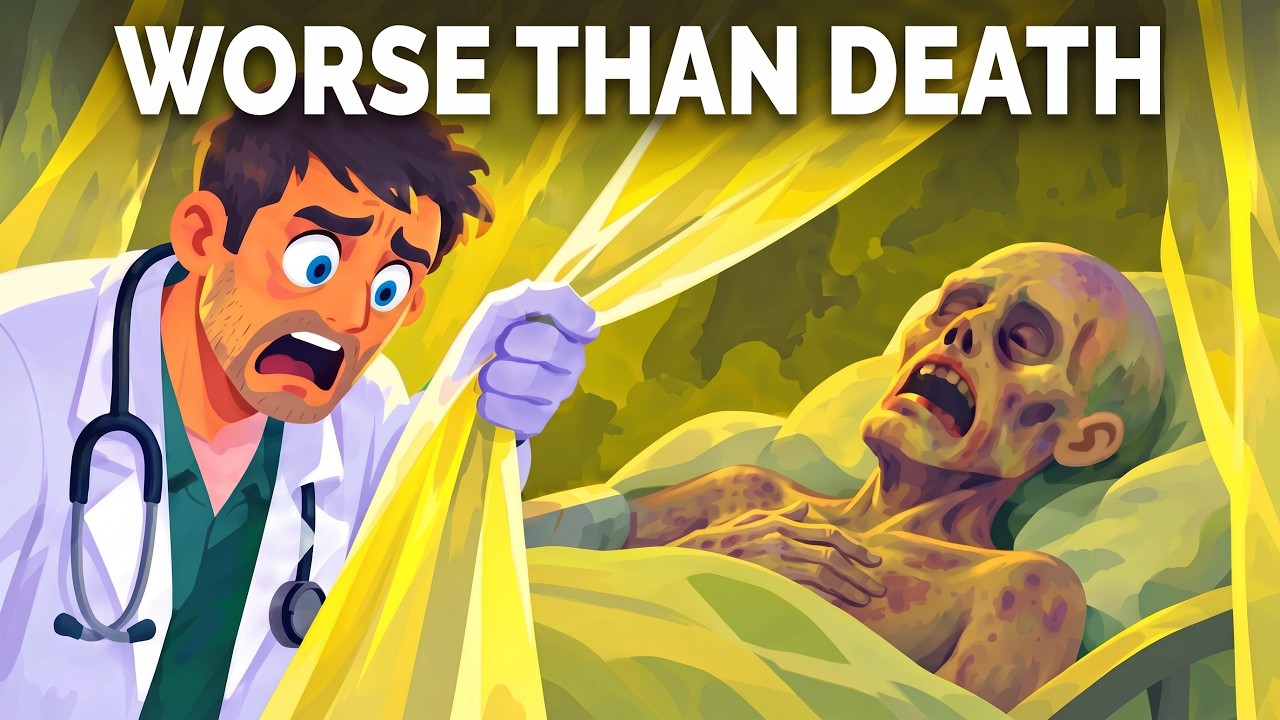
  4. 4 What Lethal Radiation Does to Your Body (Hour by Hour) 2.4M views · 7.9K likes · 644 comments · Oct 2026
  5. 5 He started his new job at 7:30 AM. By 9:45 AM, he grounded America. 2.4M views · 19.4K likes · 1.7K comments · Sep 2026
  6. 6 The Collapse of AI Software Engineering 1.9M views · 16.3K likes · 2.7K comments · Sep 2026
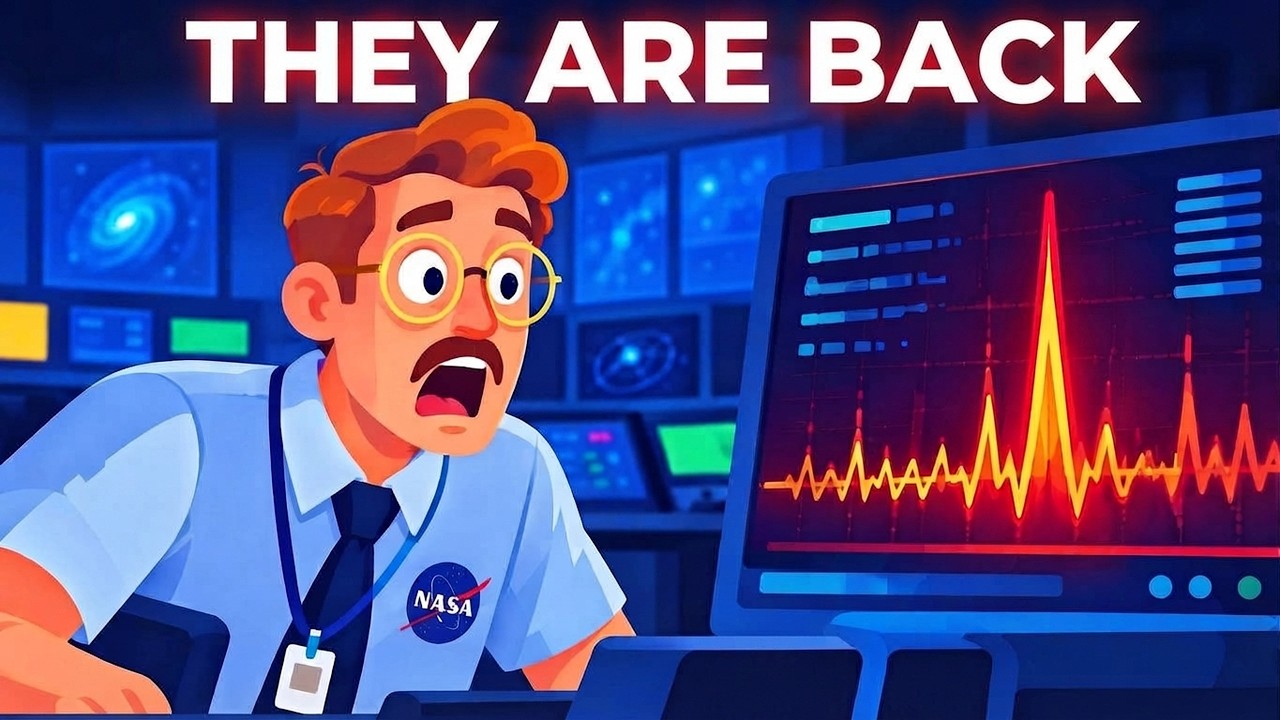
  7. 7 Voyager 2 Discovered Something Strange at the Edge of Our Solar System 1.9M views · 10.2K likes · 876 comments · Sep 2026

💡 Facts

🗓️Joined YouTube in 2011 — 15 years ago.
🏆Ranked #381 among all influencers on SocialDB.
🎯Top Knowledge influencer — #16 in the niche.
👁️Averages 635K views per video.
📤Posts about 11.2× per week.
🏅Earned the Diamond Play Button for passing 10M subscribers.
📍Based in United States.

💚 Brand affinity

Estimated

Brands The Infographics Show's audience is most likely to respond to — from detected sponsorships in this niche.

Keeps Nebula Shopify Coinbase Fiverr Robinhood Incogni Audible NordVPN Webull

About

Facts are fun, but most are presented in boring and badly edited videos. The Infographics Show focuses on making animated motion infographic videos, made in a fun and entertaining way. Software that we use: Adobe Audition for voice recording, Adobe Illustrator for dealing with vectors, and Adobe After Effects for animation. If you want to sponsor a video or discuss any other business-related things, you can get our email below.

📸 Gallery

Frequently asked questions

How much does The Infographics Show charge for a sponsorship?
The Infographics Show hasn't published fixed prices yet. Send a proposal through SocialDB and agree terms directly — your payment is held in escrow until the work is approved.
How do I contact The Infographics Show for a brand deal or collaboration?
Send a paid deal or collab request right here on SocialDB — we notify The Infographics Show, and once they accept, your payment is held safely in escrow and released when the work is approved. You don't need to track down an email.
How many subscribers does The Infographics Show have?
The Infographics Show has 15,500,000 subscribers on YouTube.

✉ Message The Infographics Show

Reaching out to influencers is a Pro feature. Upgrade to message any influencer directly — perfect for brands and agencies booking sponsorships.

See Pro $9.95/mo →

Already Pro? Log in.

🎤 Event / appearance with The Infographics Show

Booking an event / appearance is a Pro feature. Upgrade to book The Infographics Show for an in-person or virtual appearance — payment held safely in escrow until the event is done.

See Pro $9.95/mo →

Already Pro? Log in.

Auto-generated from YouTube's public data — no affiliation with or endorsement by SocialDB. Is this you? Claim it · Remove

✉️ Contact