
The Engineer's Desk✓ Add us as a preferred source on Google
Make a deal with The Engineer's Desk
🔒 Paid proposals held safely in escrow — released only when the work's approved.
Known for
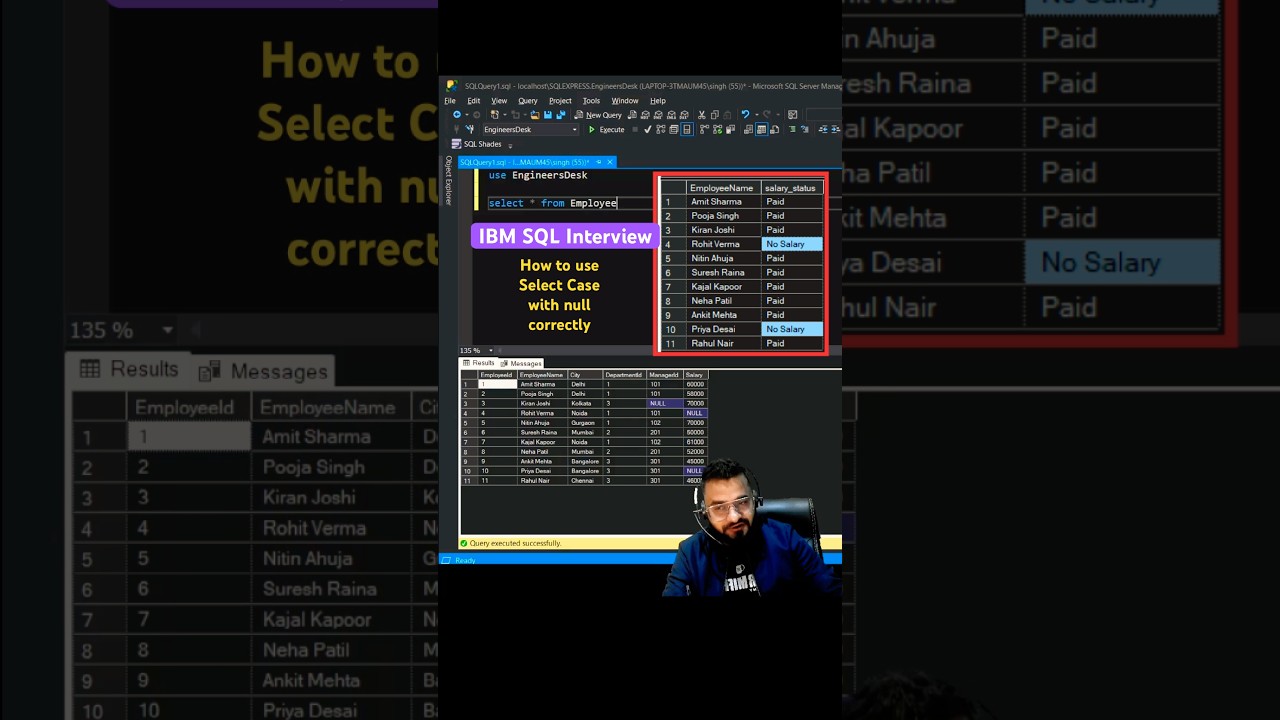 38.7K views
How to use select case correctly with null - IBM SQL interview #coding #sql #sqlqueries
38.7K views
How to use select case correctly with null - IBM SQL interview #coding #sql #sqlqueries
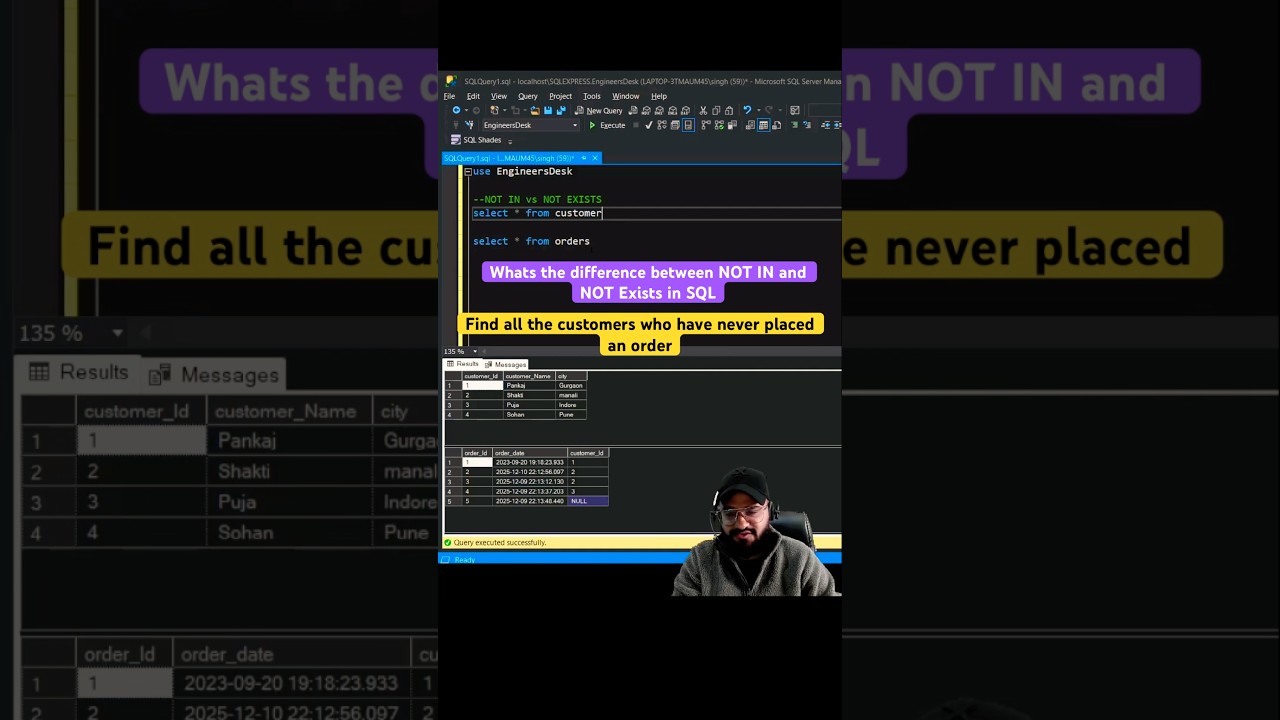 26.1K views
Find all the customers who never placed an order - NOT IN vs NOT EXISTS #sql #coding #sqlqueries
26.1K views
Find all the customers who never placed an order - NOT IN vs NOT EXISTS #sql #coding #sqlqueries
 19K views
Difference between Call, Apply and Bind explained under 1 minute #javascript #coding #frontend
19K views
Difference between Call, Apply and Bind explained under 1 minute #javascript #coding #frontend
 18.8K views
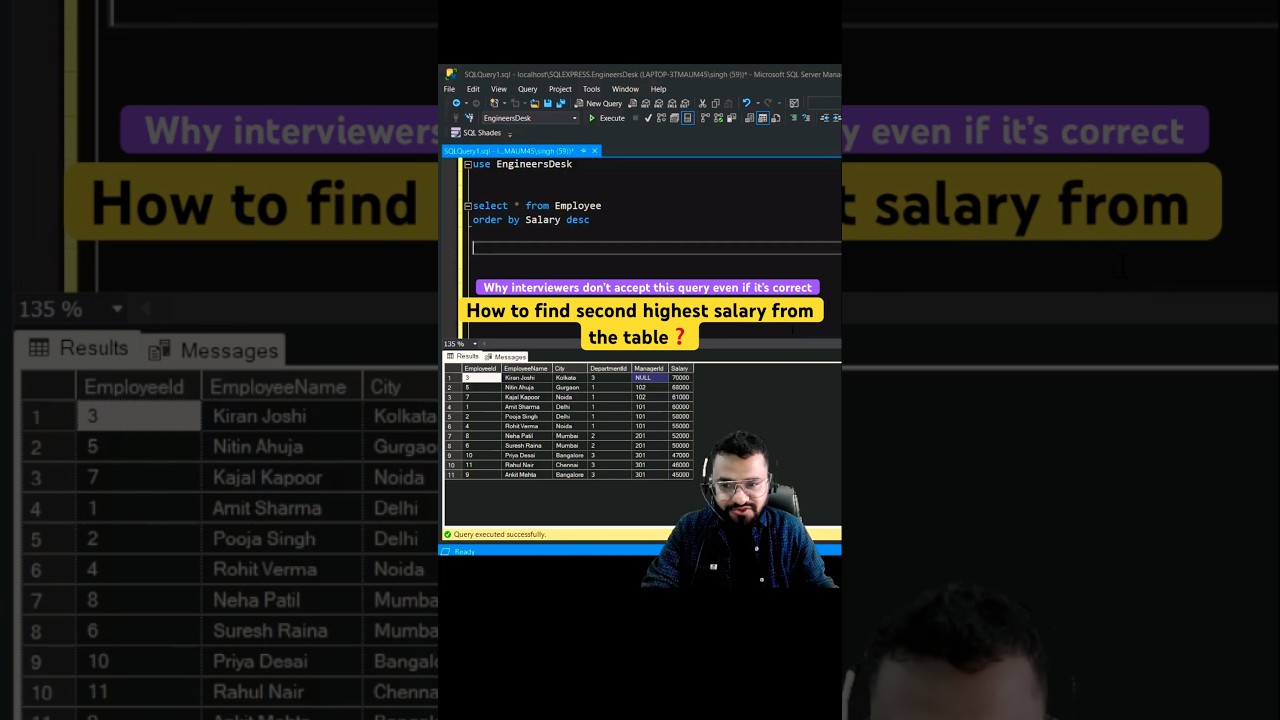
Why you should never use Row_Number function to find nth highest salary ? #sql #sqlqueries #coding
18.8K views
Why you should never use Row_Number function to find nth highest salary ? #sql #sqlqueries #coding
📈 Growth momentum
Holding steady🎯 Reach quality
📈 Performance
🗓️ Posting schedule
▶️ Top videos
✓ Official stats
💡 Facts
💚 Brand affinity
EstimatedBrands The Engineer's Desk's audience is most likely to respond to — from detected sponsorships in this niche.
 Shopify
About
📸 Gallery


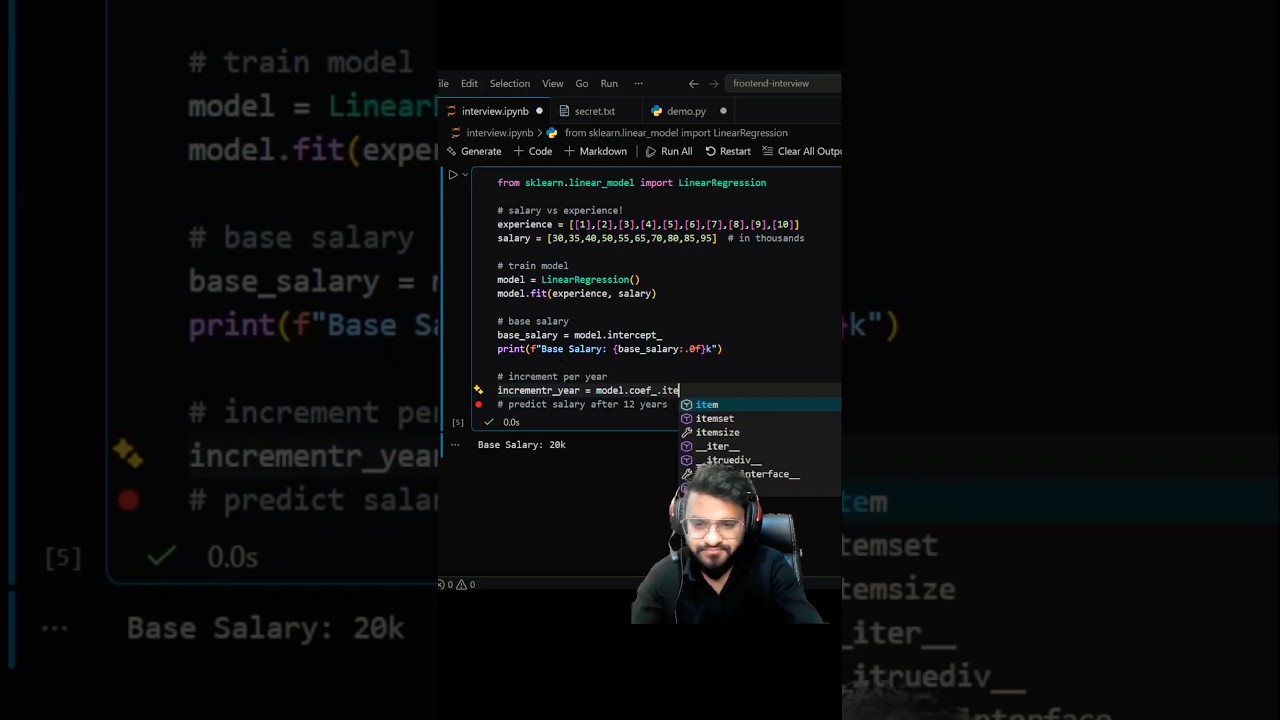
Recent videos
More like this
Find more →


Frequently asked questions
How much does The Engineer's Desk charge for a sponsorship?
How do I contact The Engineer's Desk for a brand deal or collaboration?
How many subscribers does The Engineer's Desk have?
✉ Message The Engineer's Desk
Reaching out to influencers is a Pro feature. Upgrade to message any influencer directly — perfect for brands and agencies booking sponsorships.
- ✓ Message any influencer from their listing
- ✓ The influencer gets notified by email
- ✓ Manage every conversation in one inbox
Already Pro? Log in.
🎤 Event / appearance with The Engineer's Desk
Booking an event / appearance is a Pro feature. Upgrade to book The Engineer's Desk for an in-person or virtual appearance — payment held safely in escrow until the event is done.
- ✓ Book them for events, livestreams, panels & more
- ✓ The Engineer's Desk gets notified by email
- ✓ Fee held in escrow, released after the appearance
Already Pro? Log in.
You're out of free requests this month
Free accounts get 5 per month. Go Pro for unlimited sponsor pitches, collab requests & sponsorship deals — plus featured placement, the Verified badge, free withdrawals and more.
Upgrade to Pro — $9.95/mo →Your free limit resets on the 1st of next month.
Auto-generated from YouTube's public data — no affiliation with or endorsement by SocialDB. Is this you? Claim it · Remove